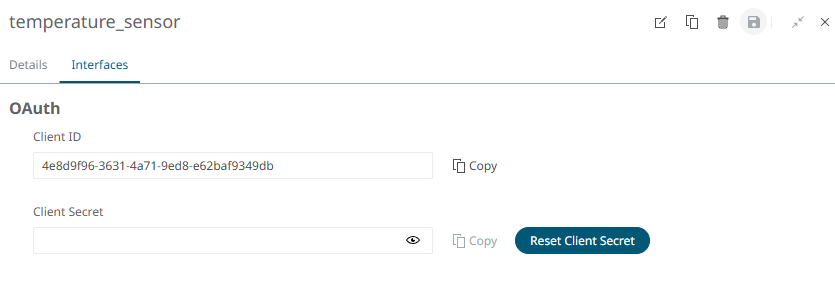
Note: The Thing Client ID and Client Secret are
required to configure the New Workbook in the Real time Visualization module. Be
sure to capture and save this information.Figure 1.
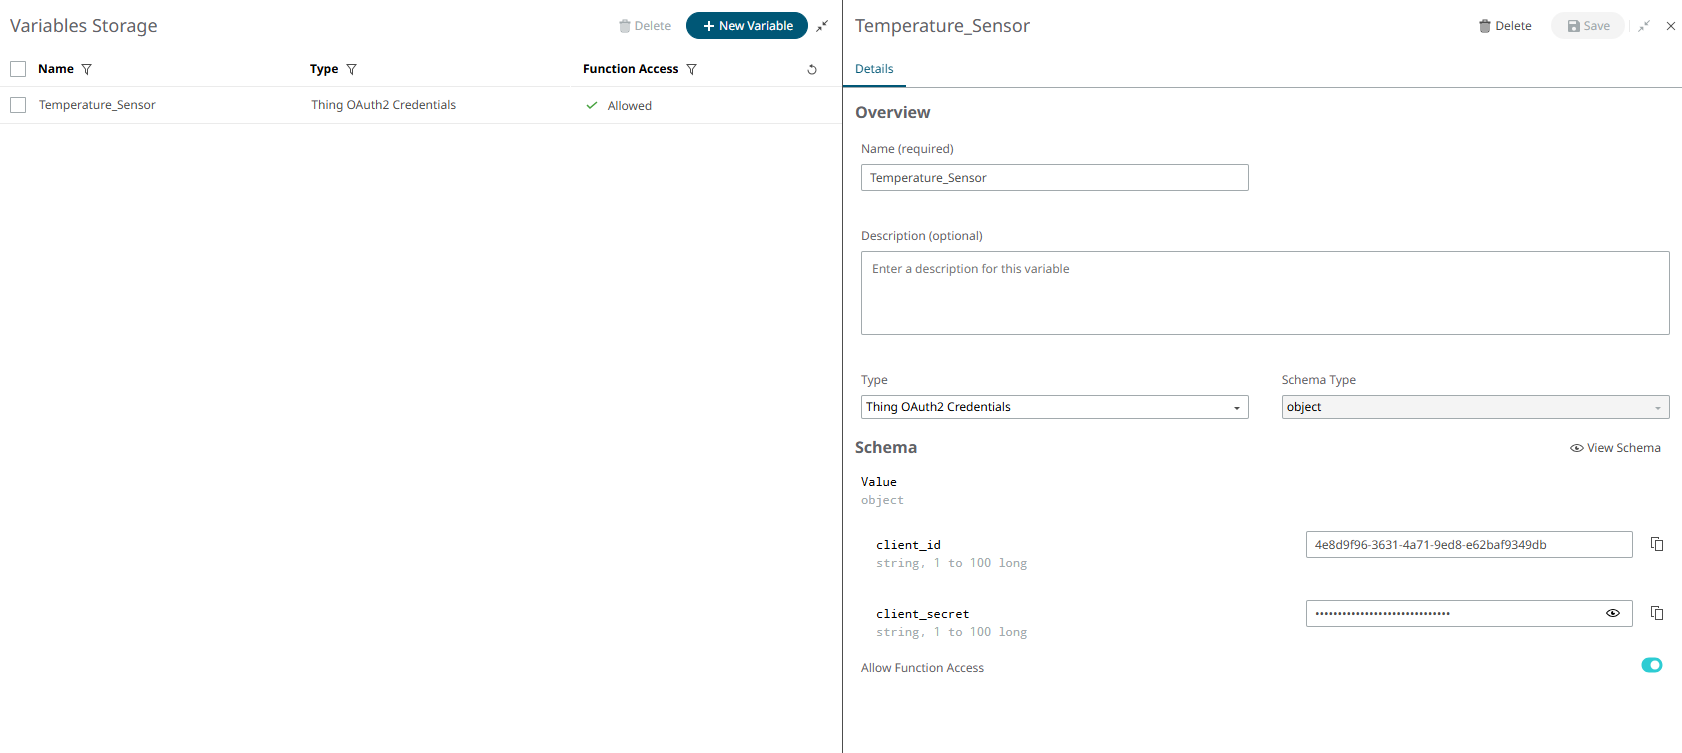
If you click to reset your Create Credentials, you can save them
in the Variables Storage section under Space Settings and access them
later. Figure 2.
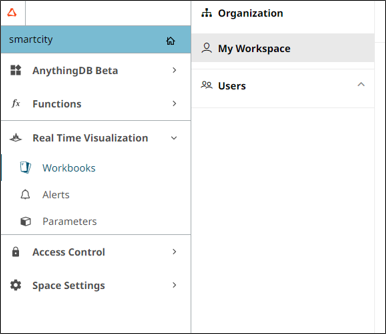
Click Real Time Visualization > Workbooks to create visualizations to understand your data.
Workbooks contain the following sections:
My Workspace: Dashboards developed by you
Users: Dashboards other users have shared with you
Figure 3.
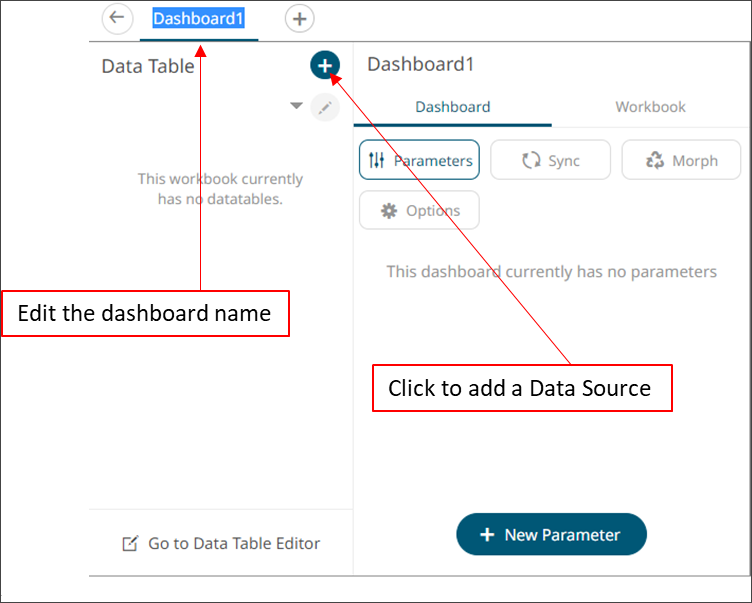
Click New Workbook, name it and click
Create.
Figure 4.
From File/URL, choose Altair IoT Studio.
Enter the following:
Operation: Get Historical Values of all the properties of a specific
thing
Client ID: from the Thing
Client Secret: from the Thing
Thing ID: from your Thing
Scope: to read the data stored - thing.read
Click to Fetch the Record path
Click Generate Columns, and then click
Refresh Preview.
The columns are populated and the requested data is
displayed.
Click Save.
Click Back to return to the Edit Dashboard view.
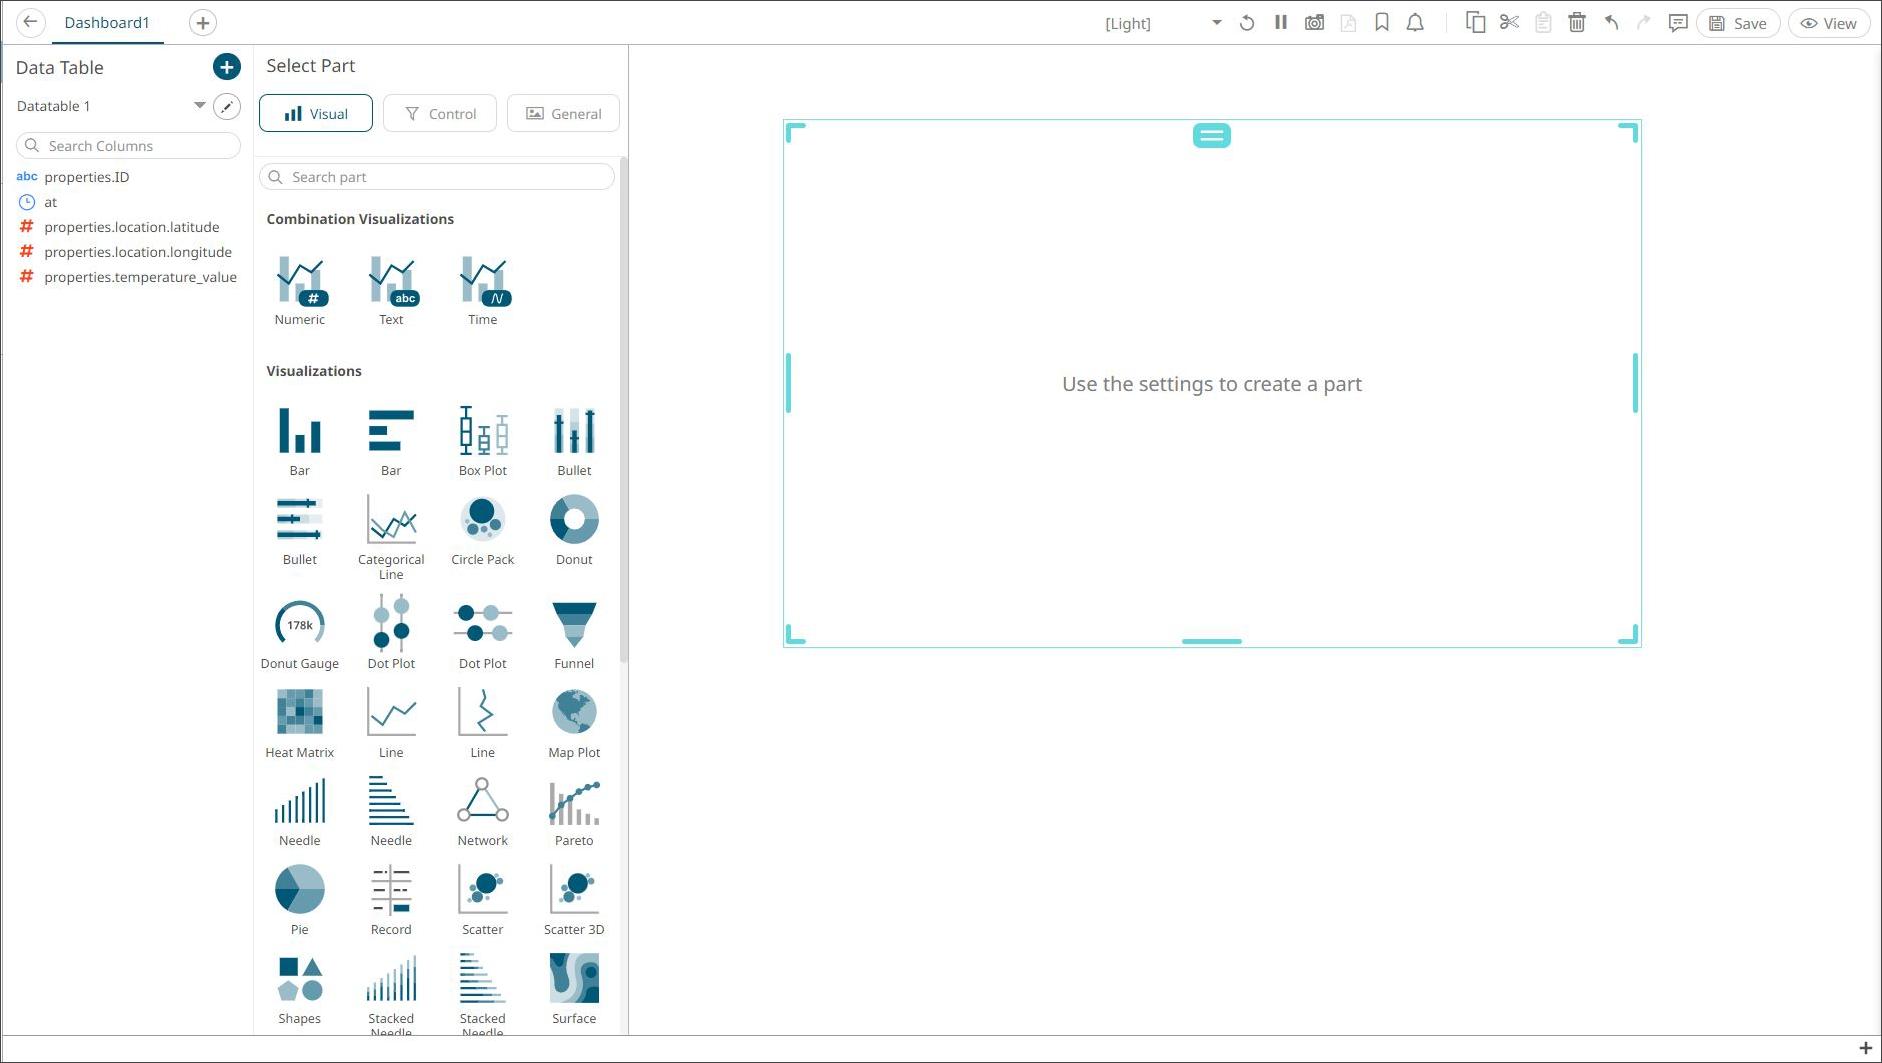
On the blank canvas (right half section), sketch a simple square by clicking
and dragging on the blank interface. This enables the Visualization menu.
Figure 5.
Select the Visualization mode and configure it using the Visualization
settings. Detailed information regarding Data Tables is available from the Panopticon Designer
documentation.